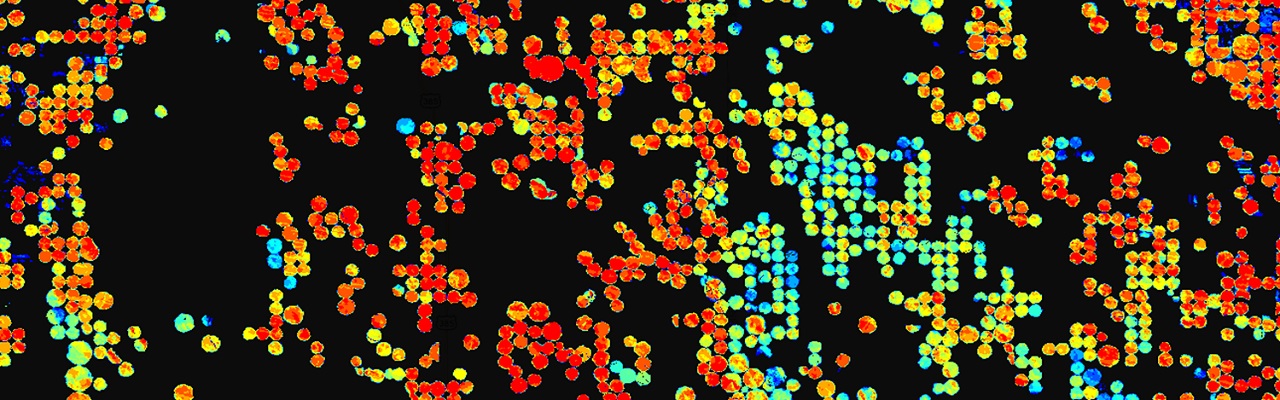
 irrigation frequency
irrigation frequency
irrigation frequency
Sustainable management of agricultural water resources requires improved understanding of irrigation patterns in space and time. We produced annual, high resolution (30 m) irrigation maps for 1999-2016 by combining all available Landsat satellite imagery with climate and soil covariables in Google Earth Engine. Random forest classification had accuracies from 92-100% and generally agreed with county statistics (r2 = 0.88-0.96). Two novel indices which integrate plant greenness and moisture information show promise for improving satellite classification of irrigation. We found considerable interannual variability in irrigation location and extent, including a near doubling between 2002 and 2016. Statistical modeling suggested precipitation and commodity price influenced irrigated extent through time. High prices incentivized expansion to increase crop yield and profit, but dry years required greater irrigation intensity, thus reducing area in this supply-limited region. Datasets produced with this approach can improve water sustainability by providing consistent, spatially explicit tracking of irrigation dynamics over time.